How to Use Data Analysis to Identify and Address Bottlenecks
- sandyarsenaulttech
- Dec 9, 2024
- 4 min read
In any business or operational process, bottlenecks can be major barriers to efficiency and productivity. Bottlenecks occur when a specific step or component in the workflow slows down the entire system, causing delays, reduced output, and frustrated teams. Fortunately, data analysis offers a powerful tool to identify these bottlenecks and implement effective solutions. This blog explores how to use data analysis to uncover and address bottlenecks in your operations.

What is a Bottleneck?
A bottleneck refers to any stage in a process that limits the flow of work, whether it's due to a slow task, inefficient resource allocation, or outdated technology. In a manufacturing environment, for example, a machine breakdown or an employee’s excessive workload can cause delays in the entire production line. Similarly, in a service-oriented business, slow customer approval processes or administrative delays can become bottlenecks that impede progress.
Step 1: Collect Relevant Data
The first step in using data analysis to identify bottlenecks is to collect data across various stages of your workflow. This can be done by tracking key performance indicators (KPIs) like throughput time, cycle time, wait time, and error rates. Tools such as workflow management systems, project management software, or custom-built databases can provide the data necessary to monitor the flow of work.
For example, if you're analyzing a customer service process, you may track the time it takes for each agent to respond to customer inquiries, the time for issue resolution, and how often customers need to be escalated to a manager. Collecting data from all touchpoints allows you to visualize where the delays are occurring.
Step 2: Visualize the Data
Once you've gathered your data, the next step is to visualize it. Tools like Gantt charts, flowcharts, or heatmaps can help illustrate where the slowdowns are occurring. Data visualization helps you quickly identify patterns and anomalies that might be contributing to the bottleneck.
For example, if your data shows that the approval process for certain tasks takes longer than expected, creating a flowchart that tracks each stage in the approval process may help identify where the bottleneck occurs. Visualization also helps determine if the issue is related to a specific team, department, or individual.
Step 3: Analyze and Pinpoint the Bottleneck
Once you have a clear visual representation of your data, analyze the results to pinpoint the specific cause of the bottleneck. Look for tasks or processes that consistently exceed their expected duration or cause delays downstream.
For instance, if a manufacturing plant is experiencing production delays, data analysis might reveal that one particular machine is causing a bottleneck due to frequent breakdowns or slow operational speed. Similarly, in a sales process, you might discover that the delay in closing deals is due to prolonged approval stages or manual data entry that slows the finalization of contracts.
Step 4: Evaluate the Impact of the Bottleneck
After identifying the bottleneck, assess how it impacts the overall workflow and business performance. This can be done by calculating the total time lost or productivity reduced because of the bottleneck. By quantifying the impact, you’ll be able to prioritize which bottlenecks to address first.
For example, if a delay in data entry is causing a bottleneck in the sales pipeline, it could lead to lost revenue and customer dissatisfaction. In a manufacturing process, a minor delay in one machine can cause a cascading effect, delaying the entire production line.
Step 5: Address the Bottleneck
With the bottleneck identified, it's time to implement solutions. Here are some strategies that data analysis can help you implement to address bottlenecks:
Automation: If a bottleneck is caused by manual tasks, automation might be the best solution. For example, using software to automate data entry or customer approvals can speed up the process and eliminate human error.
Resource Allocation: Data analysis can also help you reallocate resources more effectively. If one team or employee is overwhelmed, redistributing workloads can ensure a more even distribution of tasks and reduce delays.
Process Redesign: Sometimes, bottlenecks occur due to outdated processes or inefficient workflows. Data analysis can highlight inefficiencies in your current system, allowing you to redesign workflows for greater efficiency.
Improved Training: If bottlenecks are due to skill gaps or lack of knowledge, training can help improve performance at the critical point of the process.
Step 6: Continuously Monitor and Optimize
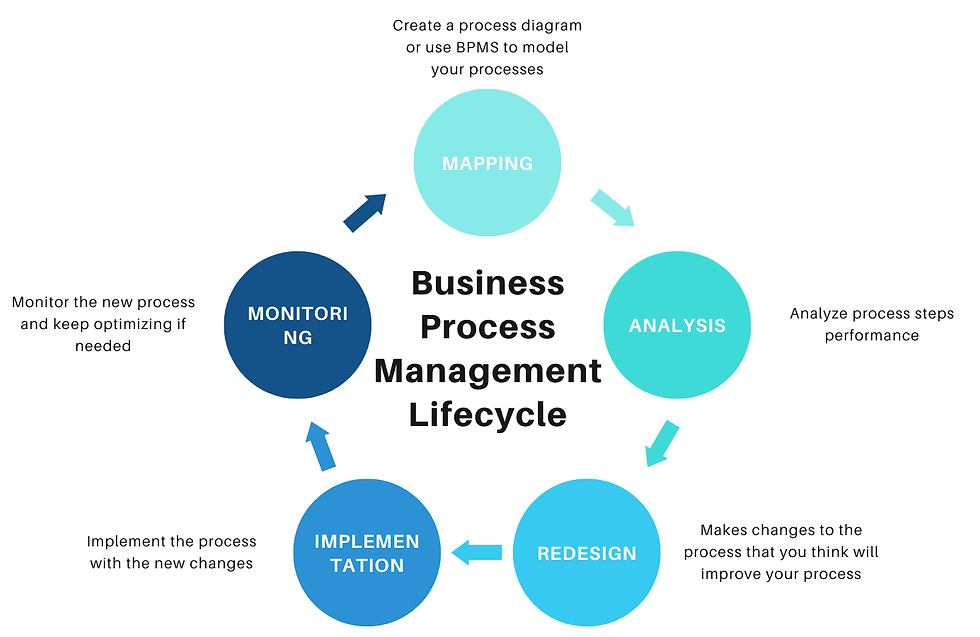
After addressing the bottleneck, it's crucial to continue monitoring your data to ensure that the solution is effective. Ongoing data analysis allows you to spot new bottlenecks before they become significant issues. Regular reviews of your workflow data help keep processes efficient and ensure continuous improvement.
Conclusion
Data analysis is an invaluable tool for identifying and addressing bottlenecks in any business process. By collecting the right data, visualizing the workflow, and pinpointing the source of the delays, businesses can implement targeted solutions that enhance efficiency and reduce wasted time. As you continuously monitor and optimize your operations, you’ll create a more agile, productive environment that supports long-term growth.
SITES WE SUPPORT
SOCIAL LINKS


Comments